Campus Health and Safety
Accident/Incident Statistics 2017
Number of Work/Study-Related Injuries
A total of 48 work/study-related injury cases were recorded in 2017. Among the cases:
-
29 cases involved staff members
-
16 cases involved students (PG in 13 cases; UG in 3 cases)
-
3 case involved contractors
A comparison of accident numbers over the past 10 years is shown in Table 1 below.
| Year | 2008 | 2009 | 2010 | 2011 | 2012 | 2013 | 2014 | 2015 | 2016 | 2017 |
|---|---|---|---|---|---|---|---|---|---|---|
| Staff Accident Number | 22 | 27 | 35 | 19 | 22 | 27 | 19 | 21 | 30 | 29 |
| Student Accident Number | 8 | 4 | 8 | 6 | 4 | 5 | 13 | 12 | 14 | 16 |
Lost Workdays
A total of 270 lost workdays were recorded for all the staff injury cases by the end of 2017. The comparison of lost workdays over the past 10 years is shown in Table 2 below.
The numbers of lost workdays in individual cases were grouped under 3 categories as shown in Table 3. In all the 29 staff work-related injury cases, 8 cases did not incur any lost workdays, 8 cases incurred 3 or fewer lost workdays and 13 cases incurred more than 3 lost workdays. The largest number of lost workdays in one single case was 73 days.
| Year | 2008 | 2009 | 2010 | 2011 | 2012 | 2013 | 2014 | 2015 | 2016 | 2017 |
|---|---|---|---|---|---|---|---|---|---|---|
| Total number of Lost Workdays | 140 | 473 | 382 | 143.5 | 432 | 272 | 389 | 82.5 | 215 | 270 |
| Department | No. of Accidents | |||
|---|---|---|---|---|
| Total | LWD=0 | 0<LWD≤3 |
LWD>3 | |
| ARO | 1 | 1 | ||
| CBME | 1 | 1 | ||
| CHEM | 2 | 2 | ||
| CLE | 1 | 1 | ||
| DAO | 1 | 1 | ||
| ECE | 1 | 1 | ||
| EVPPO | 1 | 1 | ||
| FMO | 7 | 3 | 4 | |
| ITSC | 1 | 1 | ||
| LIB | 1 | 4 | 1 | |
| LIFS | 5 | 1 | 1 | |
| PHYS | 1 | |||
| SAO | 2 | 1 | 1 | |
| SHRLO | 3 | 3 | ||
| URAO | 1 | 1 | ||
| Total | 29 | 8 | 8 | 13 |
LWD = Lost Workday(s)
Causes of Work/Study-Related Injuries
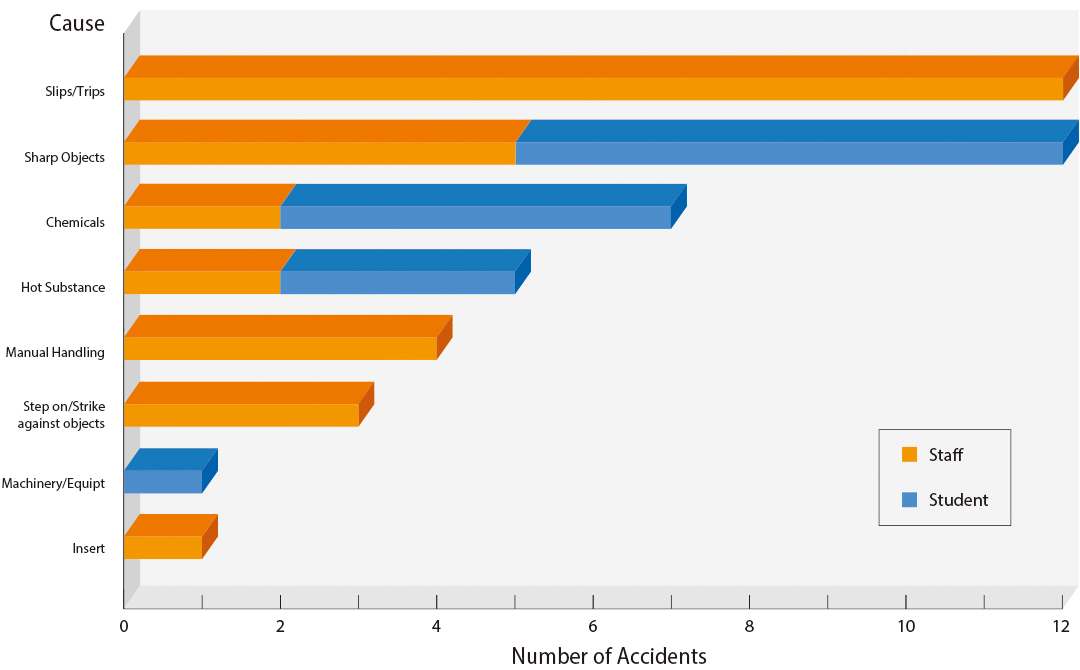
Figure 1 summarizes the causes for all work/study-related injuries in 2017.
“Slips/Trips” and “Cuts by Sharp Objects” were the top causes for work/study-related injuries in 2017, both having 12 cases. All the 12 “Slips/Trips” cases involved staff members. Among the cases, 7 were considered as due to negligence, and 5 were due to unsafe physical conditions where improvements were needed. Among the 12 cases caused by “sharp objects”, 5 cases were caused by improper use of cutters, 4 cases caused by broken glassware, and 3 cases caused by needles.

Locations of Accidents
Among all the injury cases (including contractors):
-
24 occurred in laboratories
-
7 occurred in outdoor common areas
-
4 occurred in indoor common areas
-
4 occurred in plant room/warehouse/workshop
-
3 occurred in student quarters
-
2 occurred off campus
-
1 occurred in office area
-
1 occurred in classroom
-
1 occurred in staff quarters
-
1 occurred in sports facility

Common Root Causes of Accidents
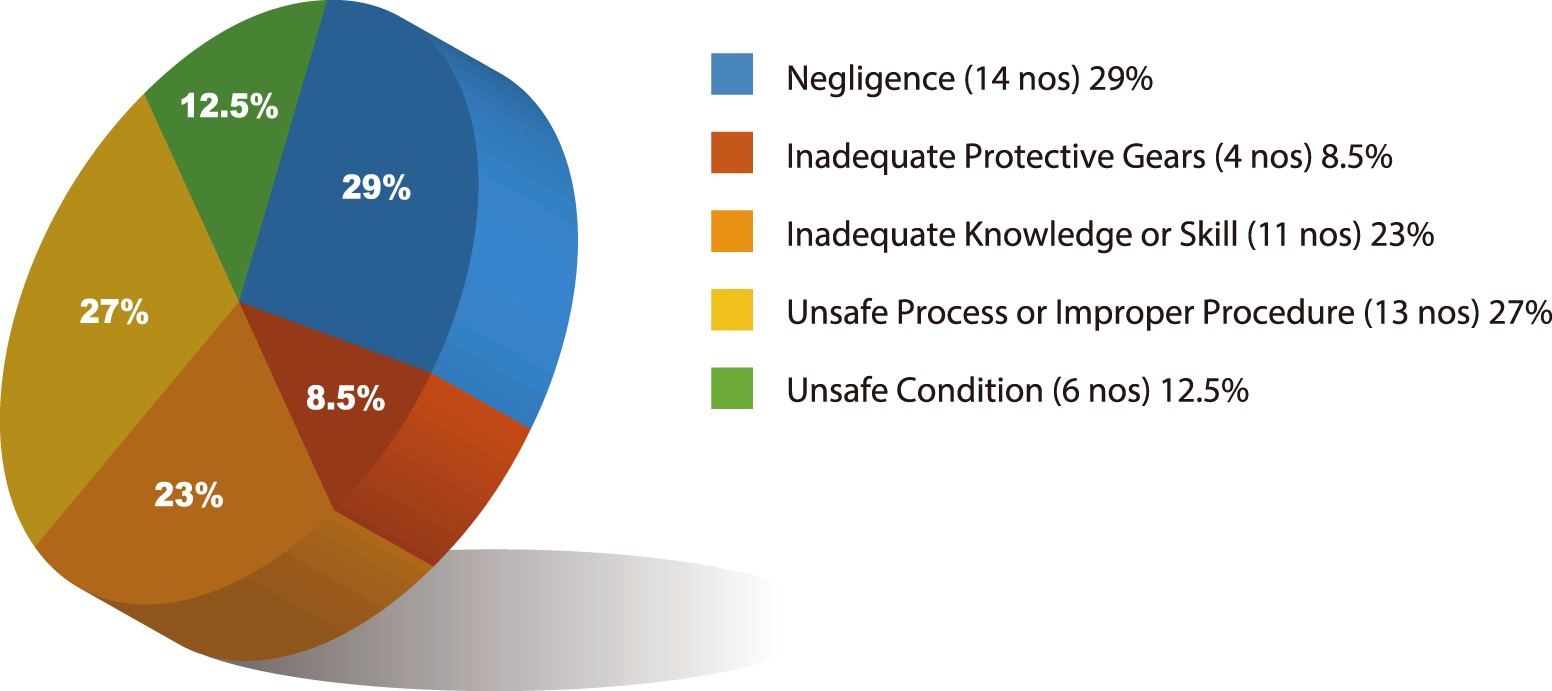
Besides classifying causes of injuries in terms of physical sources and energies involved, investigation of the injury cases also revealed some common underlying root causes. These root causes are summarized in Figure 2 below.

Non-injury Incidents
A total of 8 non-injury work/study-related incidents were reported in 2017. All the incidents occurred in laboratory areas. 7 out of the 8 incidents involved students. These incidents are summarized below by their nature:
-
Chemical spill due to accidental dropping of a glass bottle – 1 case
-
Strong smell from experiments – 2 cases
-
Flooding in laboratory – 1 case
-
Small fires – 3 cases (2 caused by chemicals; 1 due to overcharging of battery)
-
Gas leakage from a glove box – 1 case

Summary of Significant Findings
-
There were 45 cases of staff and student accidents in 2017, 1 case more than that of the previous year. The number of student accidents had increased by 2 cases, while the number of staff accidents had reduced by 1 case.
-
Among the 16 student injury cases, 13 of them involved postgraduate students and 3 involved undergraduate students.
-
The number of lost workdays in 2017 was 270 days, 55 days more than the previous year.
-
The major causes for injuries in 2016 were “cuts by sharp objects” and “slips and trips”, each having 12 cases. These 2 major causes had contributed to over half (53%) of the total. The causes of accidents were more focused in 2017, with only 8 different types of causes, as compared with 10 to 15 different causes in the previous years.
-
All 16 cases of student accidents happened in laboratory areas, attributed by 4 different causes, namely: “Slips/Trips”, “Chemicals”, “Hot Substance”, and “Equipment/Machinery”.
-
As far as the “root causes” of accidents were concerned, 29 % of all accident cases were due to negligence of the injured persons, the highest among all root causes.
-
Among the 16 student accidents, 50% were attributed to “inadequate knowledge or skill” of the students, and 38 % were attributed to “Unsafe work process or improper procedure”, which was quite similar to the previous year.
-
Half of the accidents (24 cases) occurred in laboratories, including all the student accident cases.


