Campus Health and Safety
HKUST Accident / Incident Statistics 2020-2021
Injury Accidents
A total of 77 work or study/research-related injuries were recorded between July 2020 and June 2021:
- 29 cases involved HKUST staff
- 23 cases involved HKUST students; and
- 25 cases involved contractors who are not HKUST employees but working on campus.
These injury accident numbers are compared with those over the past ten years as shown in Table 1. The numbers of staff and student injuries are comparable to those of previous years. However, the number of contractor injury is a record high given that over 300 contract guards were deployed to work on campus who involved in 9 injuries, other CMO contractors had 8 injuries, CDO and CSO contractors had 5 and 3 injuries respectively.
| Table 1: Injury Accident Statistics in The Past Ten Years | |||||||||||
|---|---|---|---|---|---|---|---|---|---|---|---|
| Year | 2011 | 2012 | 2013 | 2014 | 2015 | 2016 | 2017 | 2018 | 2019 (1) | Jul 2019 to Jun 2020 (2) | Jul 2020 to Jun 2021 (2) |
| Staff | 19 | 22 | 27 | 19 | 21 | 30 | 29 | 17 | 20 | 21 | 29 |
| Student | 6 | 4 | 5 | 13 | 12 | 14 | 16 | 27 | 19 | 22 | 23 |
| Contractors | 4 | 4 | 4 | 6 | 3 | 4 | 4 | 9 | 10 | 12 | 25 |
| Total | 29 | 30 | 36 | 38 | 36 | 48 | 49 | 53 | 49 | 55 | 77 |
Notes:
(1) HSEO compiled accident/incident data on a calendar year basis (from 01 January to 31 December) up to the end of 2019.
(2) Reporting data on a fiscal year basis (from 01 July to 30 June) commenced for 2019-2020 and 2020-2021.
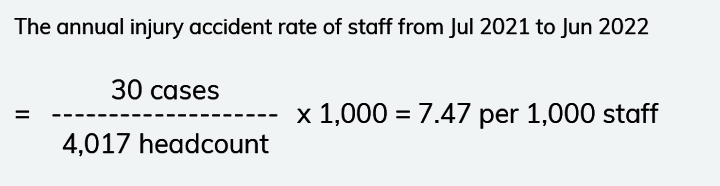
The headcount of staff includes the numbers of both full-time and part-time employees and is taken as the largest size of employment during the 12-month period. The information of headcount was published in the PAIR portal maintained by OIR.
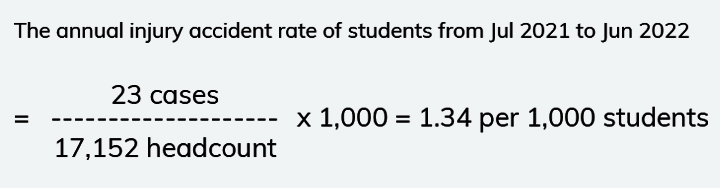
The headcount of students is taken as the largest size of enrollment during the 12-month period. The information of headcount was published in the PAIR portal maintained by OIR.
The annual injury accident rate of contractors is not provided since the headcount of contractors was not known.
Monitoring of the Annual Injury Accident Rates
An annual rate is expressed in the number of injury accidents per 1,000 staff or students. This is a standard way to tidy up the annual rates to monitor the trends over time. The control charts of annual injury accident rates of staff and students in the previous ten years are shown in Figures 1 and 2 respectively.
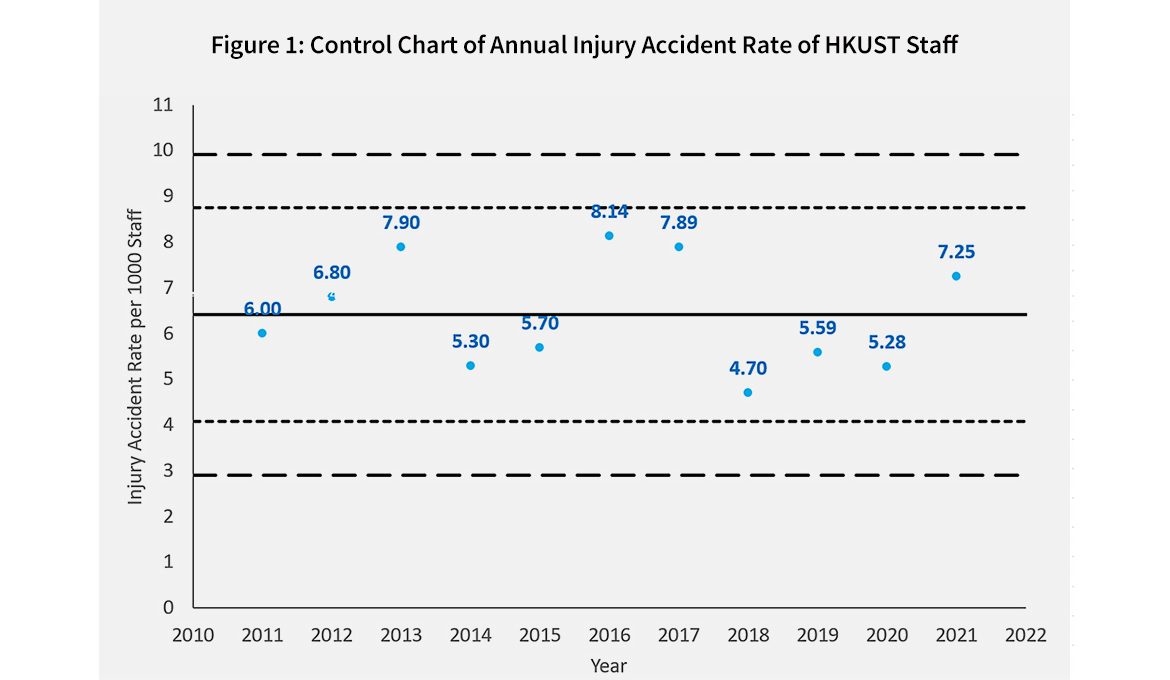
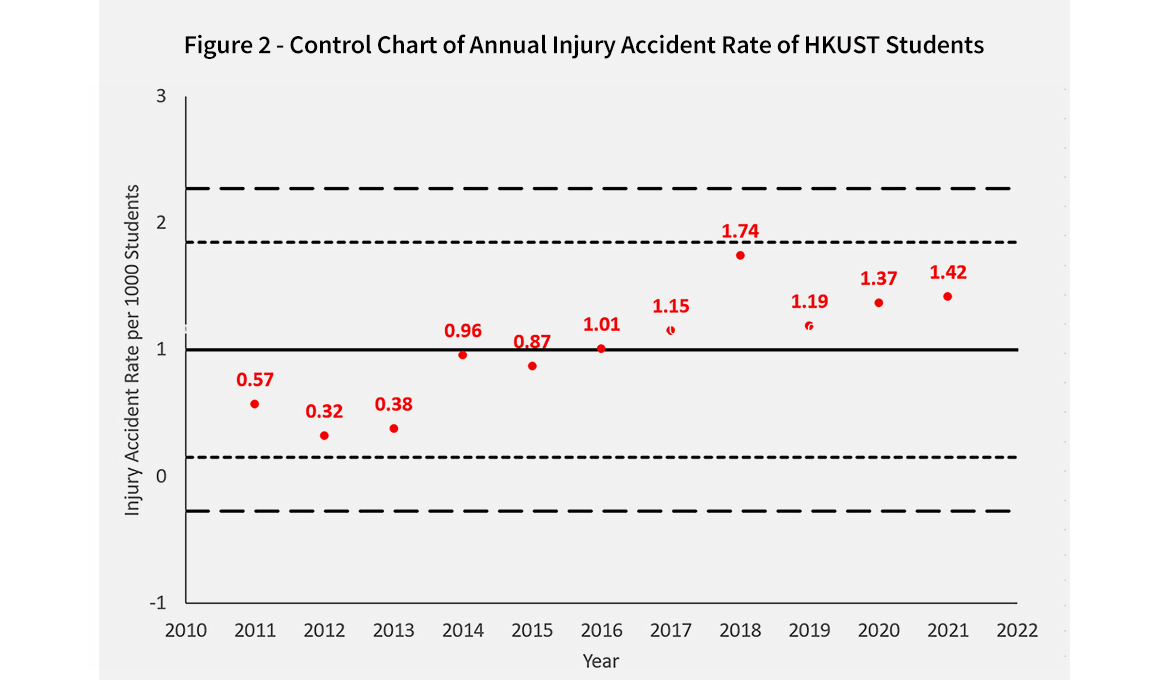
The safety system (occurrence of work or study/research-related injury accidents) is regarded as out of control if at least one of the following occurs(3):
- One point lies beyond the 3σ level.
- Two of three consecutive points lie beyond the 2σ level on same side of the mean.
- Seven consecutive points lie on one side of the mean.
- Seven consecutive points are monotonically increasing or decreasing.
Note: (3) Reference: Prevette, Professional Safety, ASSE, May 2006, pp34-41
The control charts in Figures 1 and 2 provide a non-subjective approach to monitor the trends of the annual injury accident rates over time. No “anomaly” has been identified so far. If, however, the control chart indicates a safety system is out of control, the reasons behind the “anomaly” should be investigated in order to identify any good or poor practice and the follow-up actions.

Lost Workdays
From July 2020 to June 2021, a total of 854 lost workdays were resulted from work or study/research-related injuries:
- 210 lost workdays of staff;
- 35 lost workdays of students; and
- 609 lost workdays of contractors.
The numbers of lost workdays of staff and students are comparable to those of previous years. LIFS staff and students suffered more injuries (a total of 15 cases) than any other departments or units. However, none of these injuries incurred any lost workdays as they were mainly needlesticks and minor cuts. In contrast, DSTO-SHRLO hall attendants involved in only 6 injury cases but had lost 162 workdays which was a higher number of lost workdays than any other departments or units.
However, the number of lost workdays of contractors in 2020-2021 is a record high, in which a contract Conference Lodge worker fell approximately 1.2m from the roof skylight surface that resulted in injuries on her face and 236 lost workdays.
Causes and Root Causes
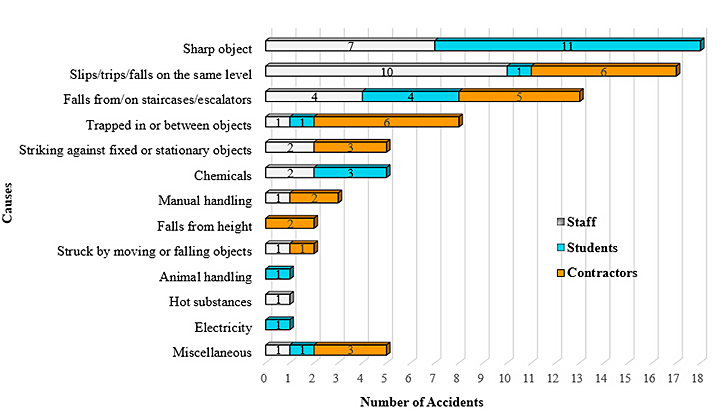
The most frequent causes of study/research-related injuries were "cuts and punctures by sharp objects" and “slips and trips” as shown in Figure 3.
Figure 3. Causes of Work and Study Related Accidents in July 2020 to June 2021
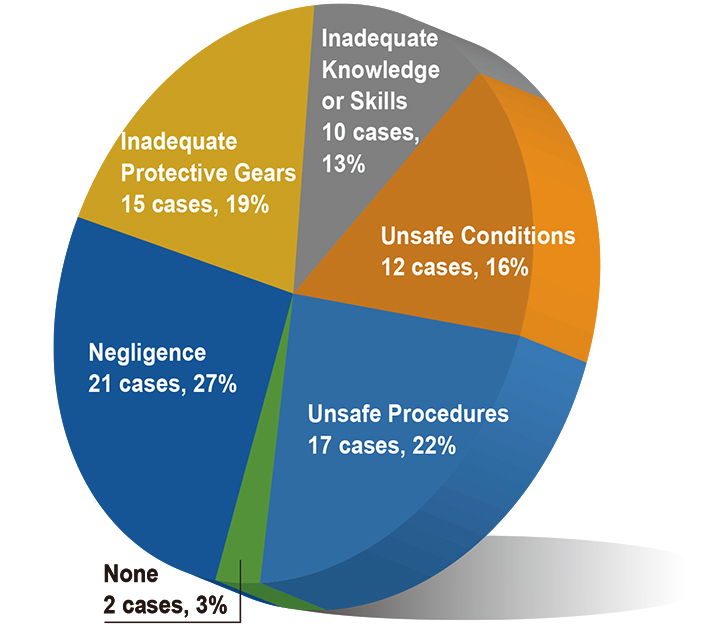
Investigations also reviewed that most accidents were caused by negligence. Other frequent causes were inadequate protective gears and unsafe procedures which highlighted the needs of enforcing proper supervision and control of all work processes. (See Figure 4.)
Figure 4. Commom Root Causes of Work and Study Related Accidents in July 2020 to June 2021
Non-injury Incidents
A total of 27 non-injury but work or study/research-related incidents were reported in 2020-2021:
- Reports of smell or suspicious gas leakage - 11 cases
- Fallen wall or ceiling tiles – 5 cases
- Property damages - 4 cases (of which 3 cases were caused by landscape/gardening works)
- Smoke/Fire from trash bins – 2 cases
- Miscellaneous – 5 cases
All injury accidents and non-injury incidents should be reported(4). Staff and students who don't take the time to report the accidents and incidents they witnessed or are involved in may not learn from them, and the causes usually go uncorrected. However, if accidents and incidents are reported, HSEO and the relevant departments/units would be able to make use of the opportunity to identify any hazards, root causes and contributing circumstances, and provide the appropriate safety training, measures and controls to rectify the problems.
Note: (4) Reference: Safety and Environmental Protection Manual, Chapter 2, Section 2: Accident Investigation. Standard Incident / Accident Report Form