Campus Health and Safety
HKUST Accident / Incident Statistics 2021-2022
Injury Accidents
A total of 82 work/study/research-related injuries were recorded between July 2021 and June 2022:
- 30 cases involved HKUST staff;
- 23 cases involved HKUST students;
- 28 cases involved contractors who are not HKUST employees but working on campus; and
- 1 case involved a visitor.
These injury accident numbers were compared with those over the past ten years as shown in Table 1. The numbers of staff and student injuries were comparable to those of previous years. However, after the significant increase in the number of contract guards deployed to work on campus since November 2019, contractor injuries hit a record high for the second year, with 25 cases in 2020/21 and 28 cases in 2021/2022.
| Table 1: Injury Accident Statistics in The Past Ten Years | |||||||||||
|---|---|---|---|---|---|---|---|---|---|---|---|
| Year | 2012 | 2013 | 2014 | 2015 | 2016 | 2017 | 2018 | 2019(1) | Jul 2019-Jun 2020(2) | Jul 2020-Jun 2021 | Jul 2021 - Jun 2022 |
| Staff | 22 | 27 | 19 | 21 | 30 | 29 | 17 | 20 | 21 | 29 | 30 |
| Student | 4 | 5 | 13 | 12 | 14 | 16 | 27 | 19 | 22 | 23 | 23 |
| Contractors | 4 | 4 | 6 | 3 | 4 | 4 | 9 | 10 | 12 | 25 | 28 |
| Total | 30 | 36 | 38 | 36 | 48 | 49 | 53 | 49 | 55 | 77 | 81 |
Notes:
(1) Data were reported on a calendar year basis (January-December) up to 2019.
(2) The Annual Report cycle changed from January-December to July-June in 2019/2020; therefore, data were reported on a fiscal year basis since then.

The headcount of staff included the numbers of both full-time and part-time employees and was taken as the largest size of employment during the 12-month period. The information of headcount was published in the PAIR portal maintained by OIR.

The headcount of students was taken as the largest size of enrollment during the 12-month period. The information of headcount was published in the PAIR portal maintained by OIR.
The annual injury accident rate of contractors was not provided since the headcount of contractors was not known.
Monitoring of the Annual Injury Accident Rates
An annual rate is expressed in the number of injury accidents per 1,000 staff or students. This is a standard way to tidy up the annual rates to monitor the trends over time. The control charts of annual injury accident rates of staff and students in the previous ten years are shown in Figures 1 and 2 respectively.
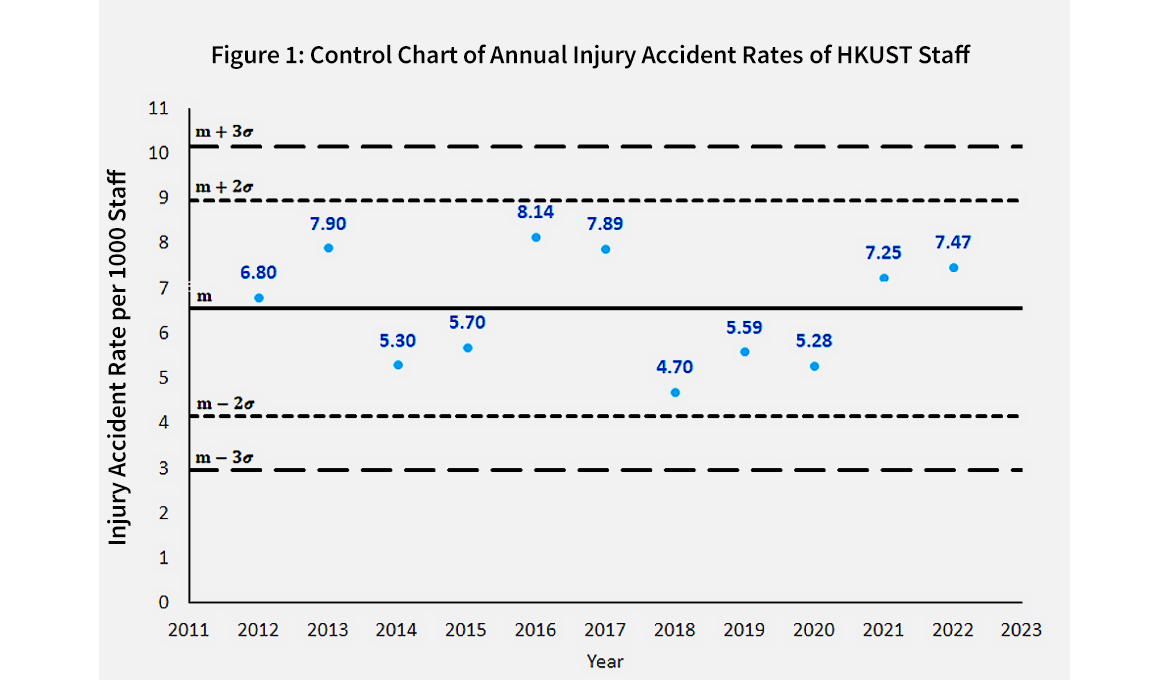
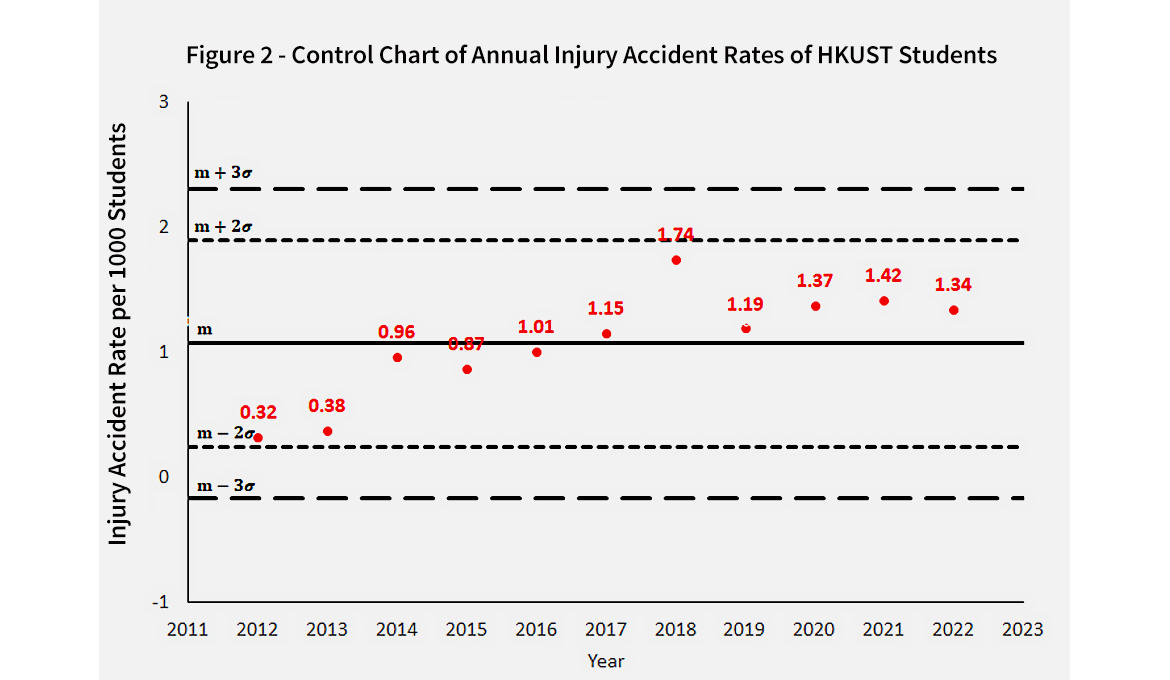
The safety system (occurrence of work/study/research-related injury accidents) is regarded as out of control if at least one of the following occurs(3):
- One point lies beyond three standard deviations of the mean (the 3σ level).
- Two of three consecutive points lie beyond the 2σ level on same side of the mean (m).
- Seven consecutive points lie on one side of the mean.
- Seven consecutive points are monotonically increasing or decreasing.
Note:
(3) Reference: Prevette, Professional Safety, ASSE, May 2006, pp34-41
The control charts in Figures 1 and 2 provide a non-subjective approach to monitor the trends of the annual injury accident rates over time. No “anomaly” has been identified so far. If, however, the control chart indicates a safety system is out of control, the reasons behind the “anomaly” should be investigated in order to identify any good or poor practice and the follow-up actions.

Lost Workdays
From July 2021 to June 2022, a total of 791 lost workdays were resulted from work/study/research-related injuries:
- 250 lost workdays of staff;
- 7 lost workdays of students; and
- 534 lost workdays of contractors.
The numbers of lost workdays of staff and students were comparable to those of previous years.
After the significant increase in the number of contract guards deployed to work on campus since November 2019, contractor injuries hit a record high for the second year, with 25 cases in 2020/21 and 28 cases in 2021/2022. On the other hand, the number of lost workdays was 534, down by approximately 12% compared to 2020/21. HSEO would continue to work with CMO-Security and other responsible departments to monitor the H&S performance of their contractors.
Causes and Root Causes
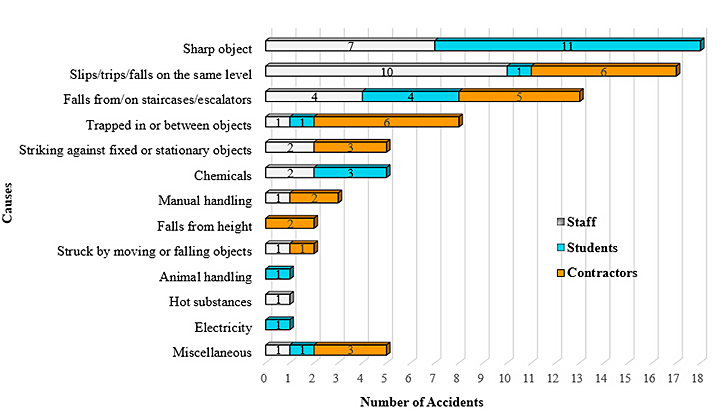
The most frequent causes of work/study/research-related injuries were “cuts and punctures by sharp objects,” “slips, trips or falls on the same level,” and “falls from/on staircases or escalators,” as shown in Figure 3.
Figure 3. Causes of Work/Study/Related Accidents in July 2021 to June 2022
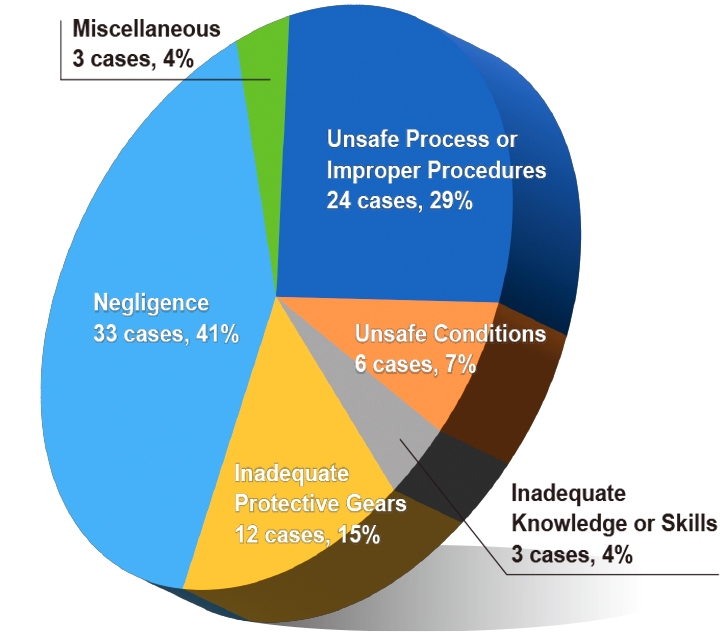
Investigations also reviewed that most accidents were caused by “negligence.” Figure 4 shows other frequent root causes were “unsafe process or improper procedures” and “inadequate protective gears,” which highlighted the need to enforce proper supervision and control of all work processes.
Figure 4. Commom Root Causes of Work/Study/Related Accidents in July 2021 to June 2022
Non-injury Incidents
A total of 49 non-injury but work/study/research-related incidents were reported in 2021-2022:
- Fire/smoke – 6 cases
- Violation of work-at-height safety – 4 cases
- Reports of smell or suspicious gas leakage – 18 cases
- Fallen or loose wall/ceiling tiles – 12 exterior and 4 interior cases
- Broken glass canopy – 1 case
- Falling object – 1 case
- Miscellaneous – 3 cases

All injury accidents and non-injury incidents should be reported(4). Staff and students who don't take the time to report the accidents and incidents they witnessed or are involved in may not learn from them, and the causes usually go uncorrected. However, if accidents and incidents are reported, HSEO and the relevant departments/units would be able to make use of the opportunity to identify any hazards, root causes and contributing circumstances, and provide the appropriate safety training, measures and controls to rectify the problems.
Note:
(4) Reference: Safety and Environmental Protection Manual, Chapter 2, Section 2: Accident Investigation.
Standard Incident / Accident Report Form
