Campus Safety
HKUST Safety Incident Statistics 2024-2025
Summary of Injury Accidents
A total of 82 work/study/research-related injuries were recorded in the 2024/25 period, from July 2024 to June 2025:
- 26 cases involved HKUST staff;
- 44 cases involved HKUST students; and
- 12 cases involved contractors who are not HKUST employees but working on campus.
Table 1 illustrates the number of work/study/research-related injuries recorded over the past ten years. We are pleased to report a slight decrease in the number of injuries among staff and contractors. However, we have observed a concerning increase in student injuries, which rose from 23 cases last year to 44 this year. We have investigated the reasons behind this increase and identified two primary factors. First, injuries due to ‘unsafe practice’ have risen by 12 cases, where students did not adhere to established safety procedures. Secondly, an increase in injuries due to ‘inadequate knowledge/skill’ has led to 7 additional injuries. The results indicated the need for enhancing safety training and safety awareness among students.
| Table 1: Numbers of Staff, Student and Contractor Injuries in the Past Ten Years | |||||||||||
|---|---|---|---|---|---|---|---|---|---|---|---|
| Year | 2015 | 2016 | 2017 | 2018 | 2019 | 2019/ 2020 |
2020/ 2021 |
2021/ 2022 |
2022/ 2023 |
2023/ 2024 |
2024/ 2025 |
| Staff | 21 | 30 | 29 | 17 | 20 | 21 | 29 | 30 | 27 | 30 | 26 |
| Student | 12 | 14 | 16 | 27 | 19 | 22 | 23 | 23 | 64 | 23 | 44 |
| Contractors | 3 | 4 | 4 | 9 | 10 | 12 | 25 | 28 | 28 | 19 | 12 |
| Total | 36 | 48 | 49 | 53 | 49 | 55 | 77 | 81 | 119 | 72 | 82 |
Notes:
(1) Data are reported on a calendar year basis (January-December) up to 2019.
(2) The Annual Report cycle changed from January-December to July-June in 2019/2020; therefore, data are reported on a fiscal year basis since then.
Annual Injury Accident Rates

The headcount of staff includes the numbers of both full-time and part-time employees and is taken as the largest size of employment during the 12 month period. The information of headcount was published in the PAIR portal maintained by OIDR.
The headcount of students is taken as the largest size of enrolment during the 12-month period. The information of headcount was published in the PAIR portal maintained by OIDR.
The annual injury accident rate of contractors is not provided since the headcount of contractors was not known.
Monitoring Trends of Annual Injury Accident Rates with Control Charts
An annual rate is expressed in the number of injury accidents per 1,000 staff or students. This is a standard way to tidy up the annual rates to monitor the trends over time. The control charts of annual injury accident rates of staff and students over the years are shown in Figures 1 and 2, respectively.
Figure 1. Control Chart of Injury Accident Rates of HKUST Staff
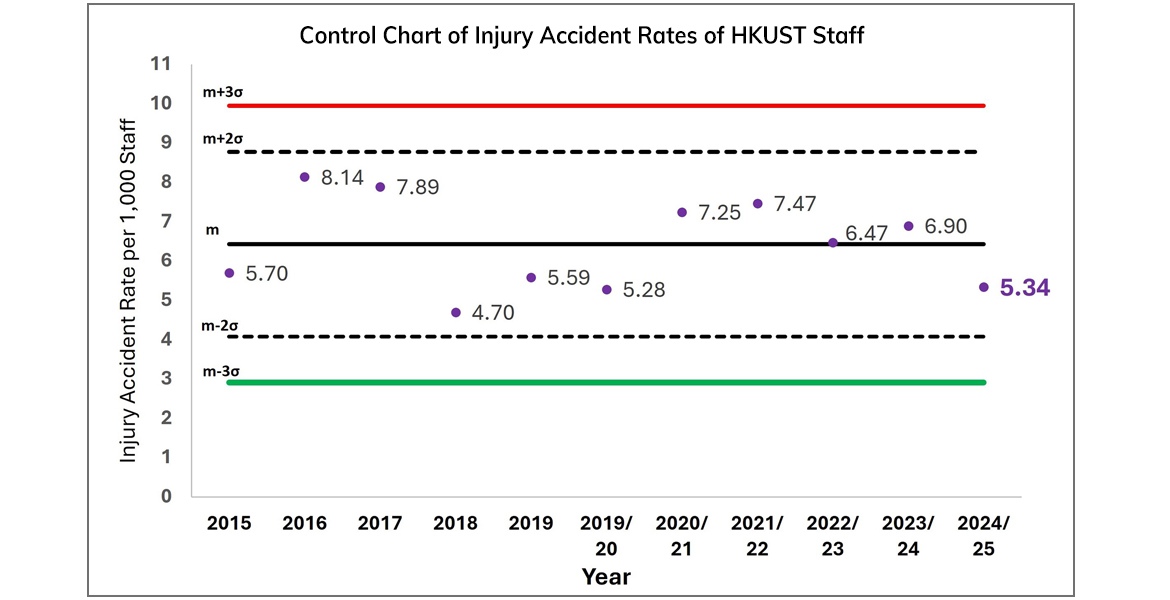
Figure 2. Control Chart of Injury Accident Rates of HKUST Students
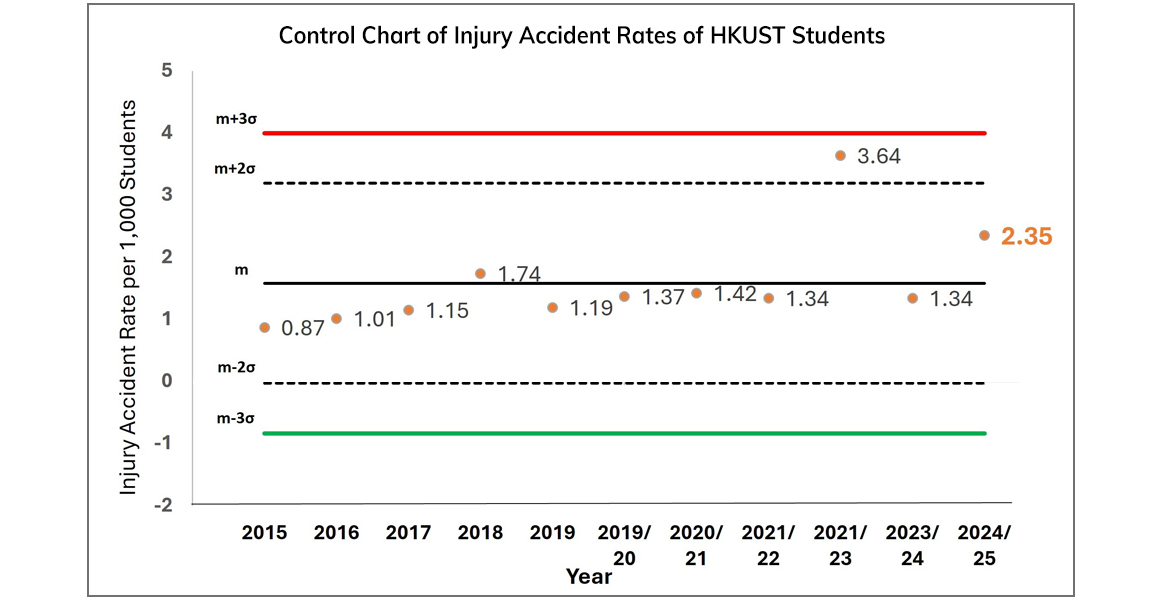
The safety system, concerning annual injury accident rates, is regarded as being out of control if at least one of the following occurs(3):
- One point lies beyond three standard deviations of the mean (the 3σ level).
- Two of three consecutive points lie beyond the 2σ level on same side of the mean (m).
- Seven consecutive points lie on one side of the mean.
- Seven consecutive points are monotonically increasing or decreasing.
Note: (3) Reference: Prevette, Professional Safety, ASSE, May 2006, pp34-41
The control charts presented in Figures 1 and 2 offer an objective means of monitoring the trends in annual injury accident rates over time. Both the staff and student injury accident control charts show fluctuations within acceptable ranges, indicating that no anomalies were detected.
Injury Incidents related to Work/Study/Research
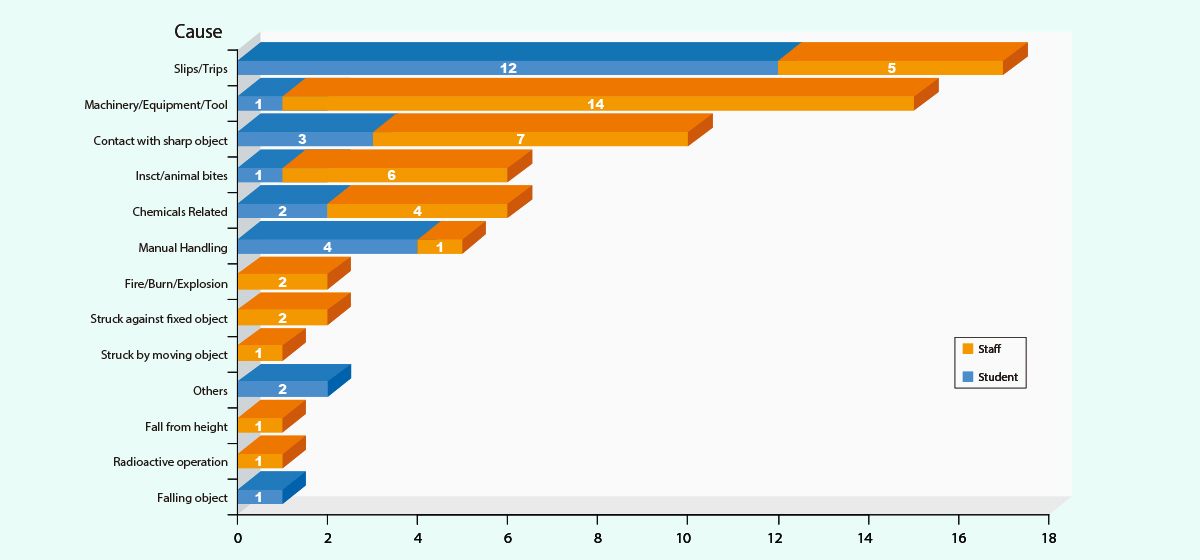
During the 2024/25 period, a total of 70 injury cases were recorded for staff and students. Among these, ‘slips/trips’ was the predominant type of work/study/research-related injury, with 17 reported cases, accounting for 24% of the total incidents. The second most common type of injury was related to ‘machine/equipment/tool’, which accounted for 15 cases, representing 21% of the total injuries. The overview of the distribution is shown in Figure 3.
Figure 3. Types of Work/Study/Research-related Injury Accidents for Staff and Students
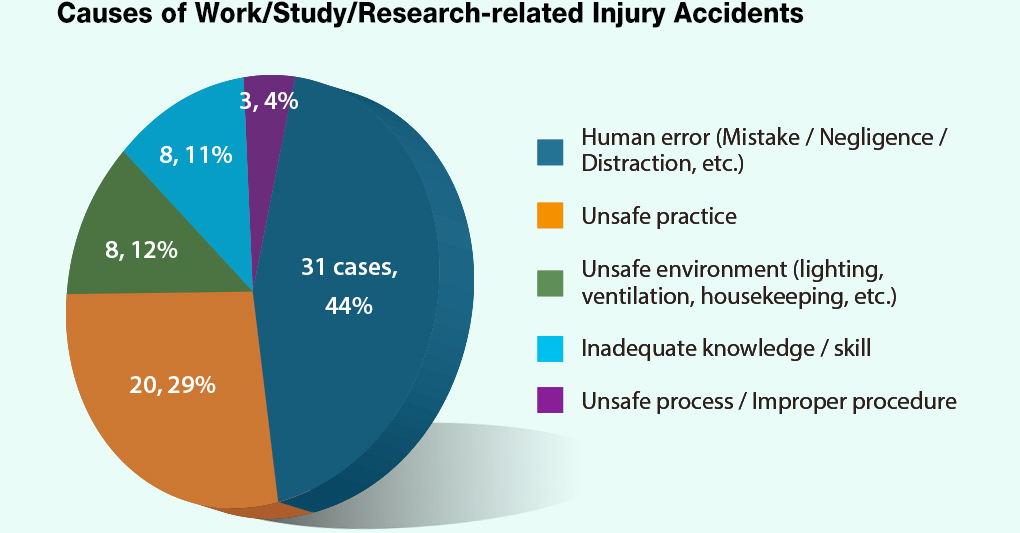
Investigations on the 70 cases revealed that ‘human error’ (44%) was the major cause of work/study/research-related injuries. Following was ‘unsafe practice’ (29%) and ‘unsafe environment’ (12%). A pie-chart of the causes is shown in Figure 4.
Figure 4. Causes of Work/Study/Research-related Injury Accidents
Non-injury Incidents related to Work/Study/Research

In the 2024/25 period, a total of 56 non-injury cases were reported, ‘odour’ (36%), ‘falling objects’ (13%), ‘false alarm’ (11%) were the top 3 types of work/study/research-related non-injury incidents. An overview of the distribution is shown in Figure 5.
Figure 5. Types of Work/Study/Research-related Non-Injury Incidents
Conclusion
The analysis of work/study/research-related injuries at HKUST during the 2024/25 period reveals both positive developments and areas that require attention. While the overall number of reported injuries among staff and contractors has decreased, the significant rise in the number of student injuries, from 23 to 44, indicates a need to enhance safety measures tailored specifically for students.
The two predominant causes of student injuries, namely ‘unsafe practice’ and ‘inadequate knowledge/skill’, emphasize the necessity for robust safety training and awareness campaigns. Furthermore, the notable prevalence of ‘slips/trips’ and ‘machine/equipment/tool-related’ injuries warrant a re-evaluation of maintenance practices and safety protocols on campus. HSEO will collaborate with relevant departments, including the Campus Management Office (CMO), to identify opportunities to enhance efforts in addressing the aforementioned needs.