Campus Safety
HKUST Safety Incident Statistics 2023-2024
Summary of Injury Accidents
In the period of July 2023 to June 2024, a total of 72 work/study/research-related injuries were recorded:
- 30 cases involved HKUST staff;
- 23 cases involved HKUST students; and
- 19 cases involved contractors who are not HKUST employees but working on campus.
Table 1 shows the number of staff, student and contractor injuries for the past 10 years.
There was a significant surge in student injuries to 64 cases in 2022/2023. The most likely reason was students returning to campus and resuming in-person learning after the COVID-19 Pandemic. The figure of student injury accidents returned to the previous level in 2023/2024.
| Table 1: Numbers of Staff, Student and Contractor Injuries in the Past Ten Years | |||||||||||
|---|---|---|---|---|---|---|---|---|---|---|---|
| Year | 2014 | 2015 | 2016 | 2017 | 2018 | 2019 | 2019/ 2020 |
2020/ 2021 |
2021/ 2022 |
2022/ 2023 |
2023/ 2024 |
| Staff | 19 | 21 | 30 | 29 | 17 | 20 | 21 | 29 | 30 | 27 | 30 |
| Student | 13 | 12 | 14 | 16 | 27 | 19 | 22 | 23 | 23 | 64 | 23 |
| Contractors | 6 | 3 | 4 | 4 | 9 | 10 | 12 | 25 | 28 | 28 | 19 |
| Total | 38 | 36 | 48 | 49 | 53 | 49 | 55 | 77 | 81 | 119 | 72 |
Notes:
(1) Data are reported on a calendar year basis (January-December) up to 2019.
(2) The Annual Report cycle changed from January-December to July-June in 2019/2020; therefore, data are reported on a fiscal year basis since then.
Annual Injury Accident Rates
The headcount of staff includes the numbers of both full-time and part-time employees and is taken as the largest size of employment during the 12-month period. The information of headcount was published in the PAIR portal maintained by OIDR.
The headcount of students is taken as the largest size of enrolment during the 12-month period. The information of headcount was published in the PAIR portal maintained by OIDR.
The annual injury accident rate of contractors is not provided since the headcount of contractors was not known.
Monitoring Trends of Annual Injury Accident Rates with Control Charts
An annual rate is expressed in the number of injury accidents per 1,000 staff or students. This is a standard way to tidy up the annual rates to monitor the trends over time. The control charts of annual injury accident rates of staff and students over the past ten years are shown in Figures 1 and 2, respectively.
Figure 1. Control Chart of Injury Accident Rates of HKUST Staff
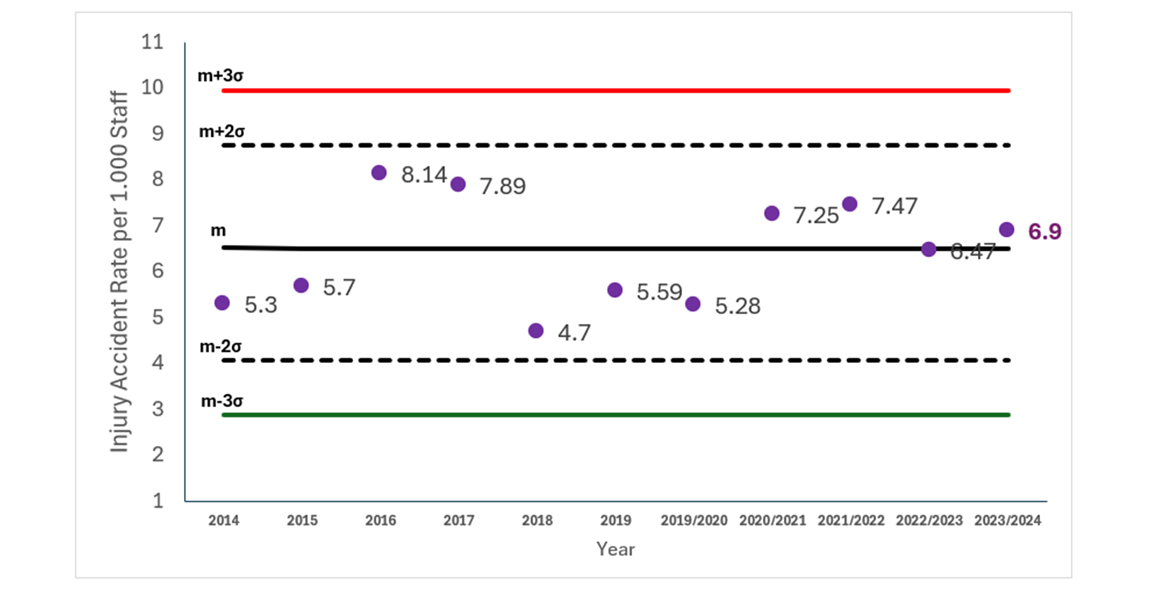
Figure 2. Control Chart of Injury Accident Rates of HKUST Students
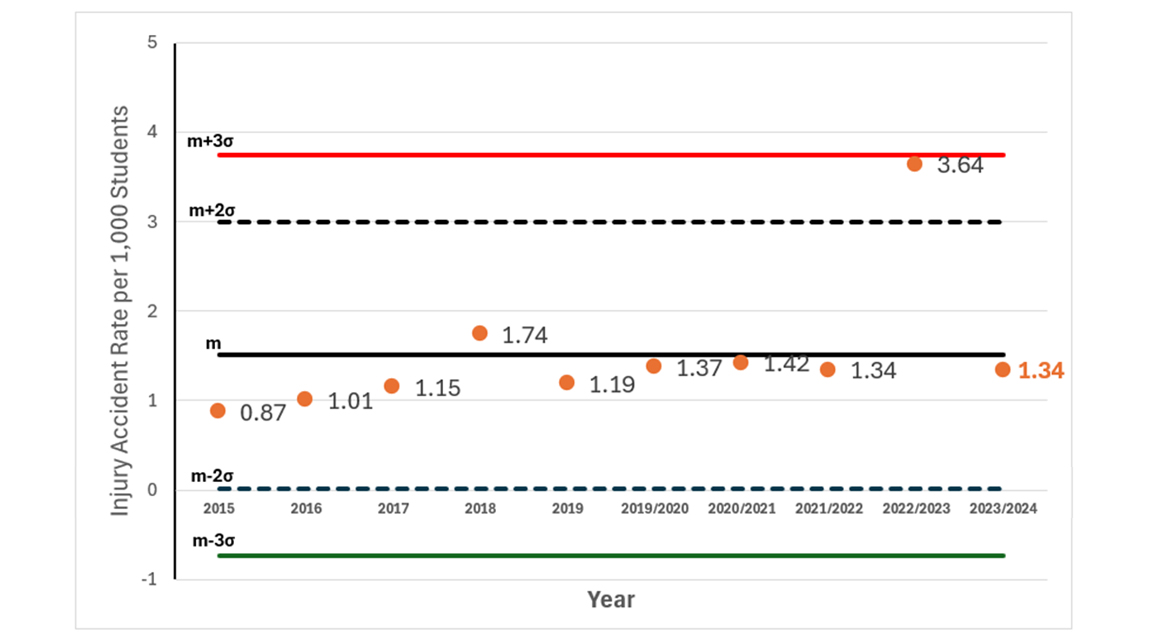
The safety system, concerning annual injury accident rates, is regarded as being out of control if one of the following occurs(3):
- One point lies beyond three standard deviations of the mean (the 3σ level).
- Two of three consecutive points lie beyond the 2σ level on same side of the mean (m).
- Seven consecutive points lie on one side of the mean.
- Seven consecutive points are monotonically increasing or decreasing.
Note: (3) Reference: Prevette, Professional Safety, ASSE, May 2006, pp34-41
The control charts in Figures 1 and 2 provide a non-subjective approach to monitor the trends of the annual injury accident rates over time. No anomaly was observed from the staff injury accident control chart. For the student injury accident control chart, other than the mean was significantly risen due to the anomalous increase of student injury accidents rate in 2022/2023, the injury rates were statistically stable and within control.
Injury Incidents related to Work/Study/Research
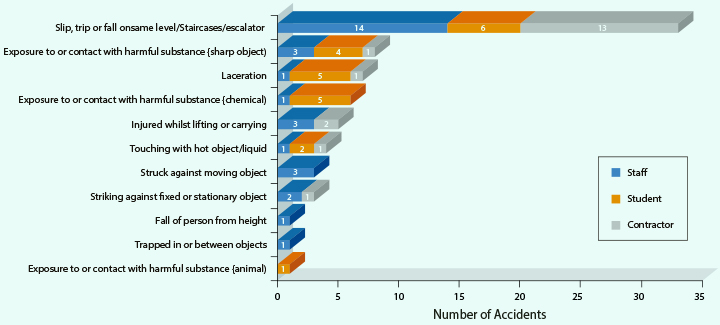
Among the 72 injury cases recorded in 2023/24, ‘slip/trip/fall’ was the predominant type of work/study/research-related injuries, accounting for over 45% of the total. The overview of the distribution is shown in Figure 3.
Figure 3. Types of Work/Study/Research-related Injury Accidents
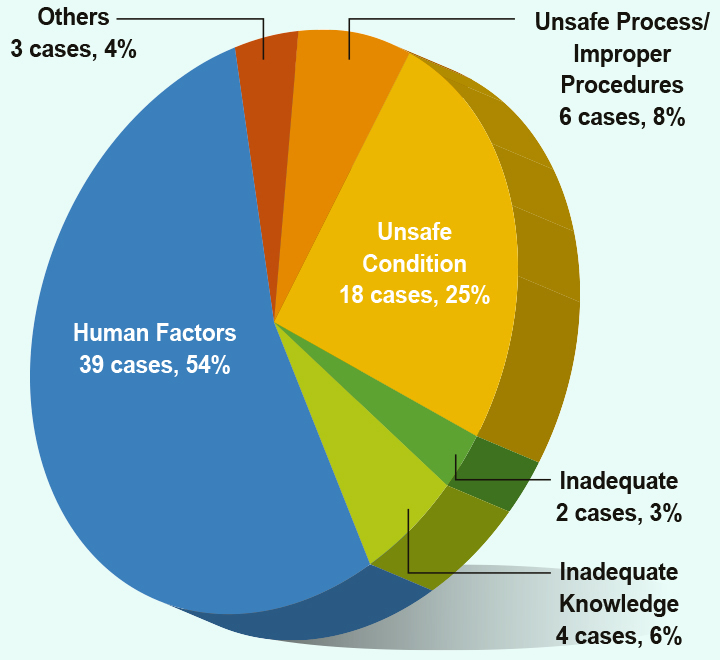
Investigations on the 72 cases revealed that 'Negligence’ (54%) and ‘Unsafe Condition’ (25%) were the major cause of work/study/research-related injuries. The overview of the distribution is shown in Figure 4.
Figure 4. Causes of Work/Study/Research-related Injury Accidents
Non-injury Incident related to Work/Study/Research
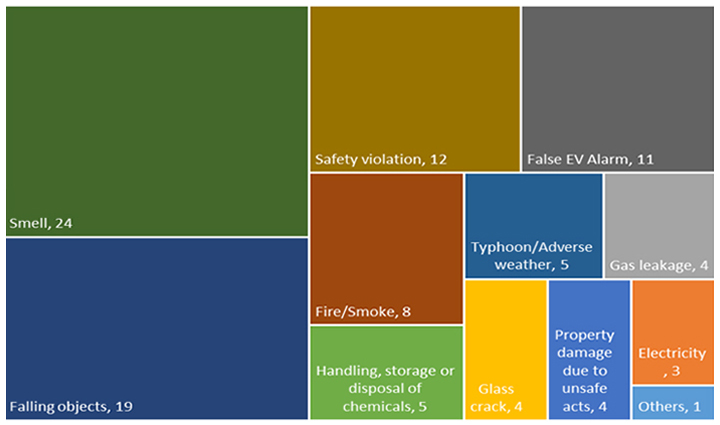
In the 2023/24 period, a total of 100 non-injury cases, ‘smell’ (24%), ‘falling objects’ (19%), ‘safety violation’ (12%) and ‘false EV alarm’ were the major types of work/study/research-related non-injury incidents. The overview of the distribution has been shown in Figure 5.
Figure 5. Types of Work/Study/Research-related Non-Injury Incidents
Conclusion
Safety is everyone’s responsibility. It is a commitment that requires participation, awareness and a collective effort from all of us to achieve zero incident. Here are the things that all of us can do to further enhance our safety culture:
- Follow safety procedures – Do not take shortcut or bypass the safety rules.
- Speak up – Report immediately if you see any unsafe conditions, near misses or incidents.
- Look out for one another – Safety is a team effort. Let’s watch each other’s backs and remind each other when necessary.
- Stop work when needed – If something doesn’t feel safe, stop and assess the situation. No task is so urgent that it cannot be done safely.
Remember, Safety Starts with Each one of Us!